Annex 1 - Forecast changes since PREFU 2023
Figure A.1 - Real GDP forecasts since PREFU 2023
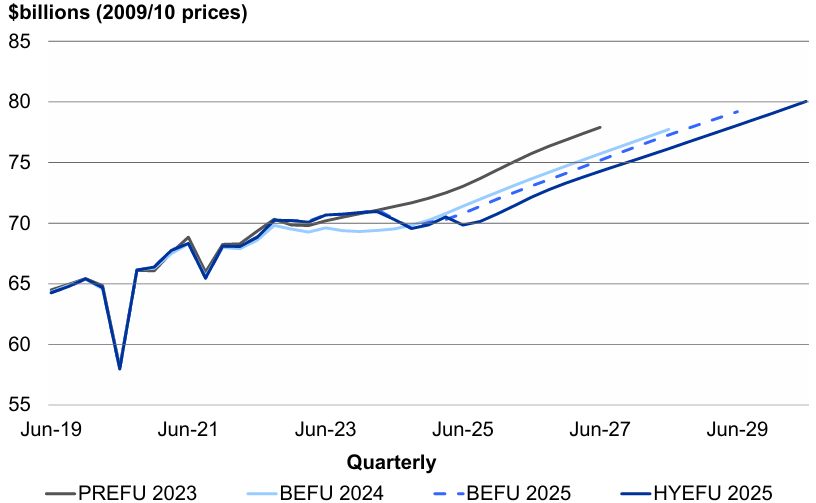
Sources: Stats NZ, the Treasury
Figure A.2 - Core Crown tax-to-GDP ratio forecasts since PREFU 2023
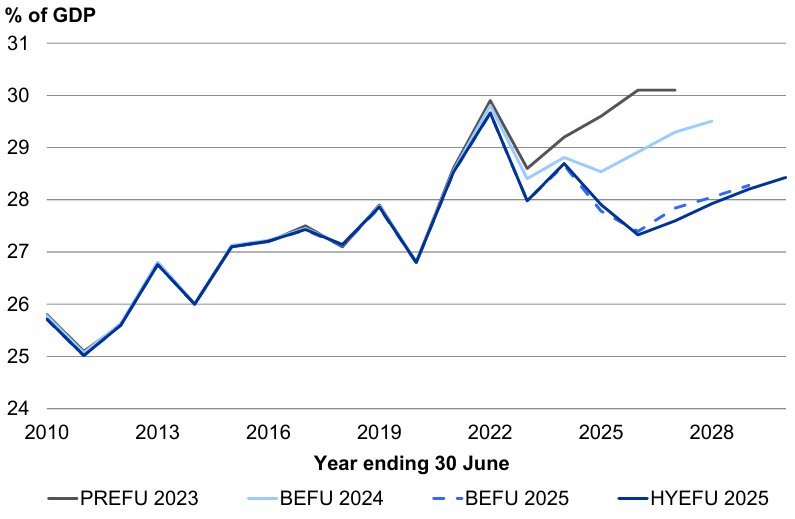
Sources: Stats NZ, the Treasury
Since the PREFU in September 2023 there have been repeated downward revisions to the Treasury's economic forecasts (Figure A.1). There are two key reasons for this. One is a better understanding of the economic downturn, which started earlier, was deeper, and has persisted for longer, than was previously understood or expected. The other is the Treasury's evolving assessment of productivity trends. With the benefit of hindsight, earlier economic forecasts attributed too much weight to an apparent pickup in productivity during the COVID-19 pandemic that did not persist.
Forecasts of GDP drive forecasts of tax revenue, benefits and some other expenses. Figure A.2 shows how the core Crown tax-to-GDP ratio - the average tax take for each dollar of income - has been revised downwards over successive forecasting rounds. This ratio is influenced by the composition of GDP, administrative and tax policy settings, historical GDP outturns and revenue forecasts.
The fiscal impact of these downward forecast revisions can be seen in Table A.1, which explains the changes in OBEGALx forecasts between the PREFU 2023 and the HYEFU 2025. The OBEGALx forecast track is lower now than it was in 2023 largely because of economic forecasts, not because of discretionary Government policy changes.
Table A.1 - Changes in OBEGALx forecasts between the PREFU 2023 and the HYEFU 2025
| Year ending 30 June $billions |
2026 | 2027 |
|---|---|---|
| OBEGALx - 2023 PREFU | 1.6 | 5.3 |
| Tax revenue (excluding Budget decisions) | (11.6) | (11.2) |
| Benefit and New Zealand Superannuation expenses (excluding Budget decisions) |
(0.4) | (0.7) |
| Debt impairments | (0.6) | (0.5) |
| Net core Crown finance costs | (0.1) | (0.7) |
| Emissions Trading Scheme forecast changes (net impact) | (0.6) | (0.4) |
| Education - forecast and depreciation changes | (0.5) | (0.6) |
| Budget packages and allowance changes | 2.3 | 2.9 |
| Baseline savings | (0.5) | (0.5) |
| Asset impairments | (0.5) | (0.6) |
| State-owned enterprise and Crown entity results | (0.5) | (0.7) |
| Other | (2.5) | (2.7) |
| Total movement | (15.5) | (15.7) |
| OBEGALx - 2025 HYEFU | (13.9) | (10.4) |
Source: The Treasury