Annex 2 — Fiscal projections
The PFA requires each fiscal strategy report to include scenarios that contain projections of trends in fiscal variables for at least the next 10 years, with stated significant assumptions. This Annex contains scenarios based on different levels of operating and capital spending in future Budgets. It illustrates a range of possible medium-term outcomes, consistent with the approach taken in the 2025 FSR.
These 10-year projections start in 2030/31 after the end of the forecast period and are produced using the Treasury's Fiscal Strategy Model. Unless otherwise stated, the projections are based on trend or long-run historical averages for economic, fiscal and demographic variables. They assume that revenue as a percentage of GDP remains broadly stable, 10‑year Government bond yields converge towards 4.3 per cent and long-run labour productivity growth converges towards 1 per cent per annum. This is a slightly higher labour productivity growth assumption than last year's FSR, reflecting data revisions and a new 30‑year average. The projections also assume that increases to welfare payments are in line with current policy settings, including rising NZ Superannuation payments as the population ages.
Importantly, the projections do not include any economic shocks, which by their nature are unpredictable.
Scenario 1: Continuation of the forecast period, with capital allowances informed by the Infrastructure Commission's Forward Guidance
Scenario 1 projects forward operating and capital allowances from the forecast period. It assumes that:
- the capital allowance is $5 billion in Budget 2030, growing at 5 per cent in subsequent Budgets, and
- the operating allowance is $2.4 billion per annum in Budget 2030, growing at 5 per cent per year in subsequent Budgets.
The 5 per cent growth rate in this scenario is higher than the 3 per cent growth rate in the 2025 FSR as it assumes that allowances grow broadly in line with the Infrastructure Commission's forward guidance for capital investment, which projects that capital investment stays relatively stable as a percentage of GDP over time. Operating allowances are also assumed to grow at 5 per cent to account for the operating costs associated with capital expenditure.
Scenario 2: Higher capital investment
Scenario 2 includes higher capital expenditure than Scenario 1. It assumes that:
- the capital allowance is $7 billion in Budget 2030, growing at 5 per cent per year in subsequent Budgets, and
- the operating allowance is $3.1 billion per annum in Budget 2030, growing at 5 per cent per year in subsequent Budgets.
The operating allowance is higher than in Scenario 1, as capital expenditure is usually accompanied by operating funding for depreciation, maintenance and other costs. Assuming $1 of operating for every $3 of capital, the operating allowance has been raised by a third of the $2 billion addition to the capital allowance.
Scenario 3: Higher operating expenses
Scenario 3 includes higher operating expenditure than Scenario 1. This scenario does not use operating allowances to manage expenditure pressures but instead assumes that operating expenditure grows unconstrained at each Budget in line with price, wage and demographic pressures, similar to the approach taken in the 2025 Long-term Fiscal Statement. No offsetting reprioritisation or efficiency savings are assumed. The capital allowance grows as in Scenario 1.
Scenario 4: Higher operating expenses and capital investment
Scenario 4 combines the higher operating expenditure from Scenario 3 with the higher capital expenditure from Scenario 2.
Figure A2.1 — Net core Crown debt
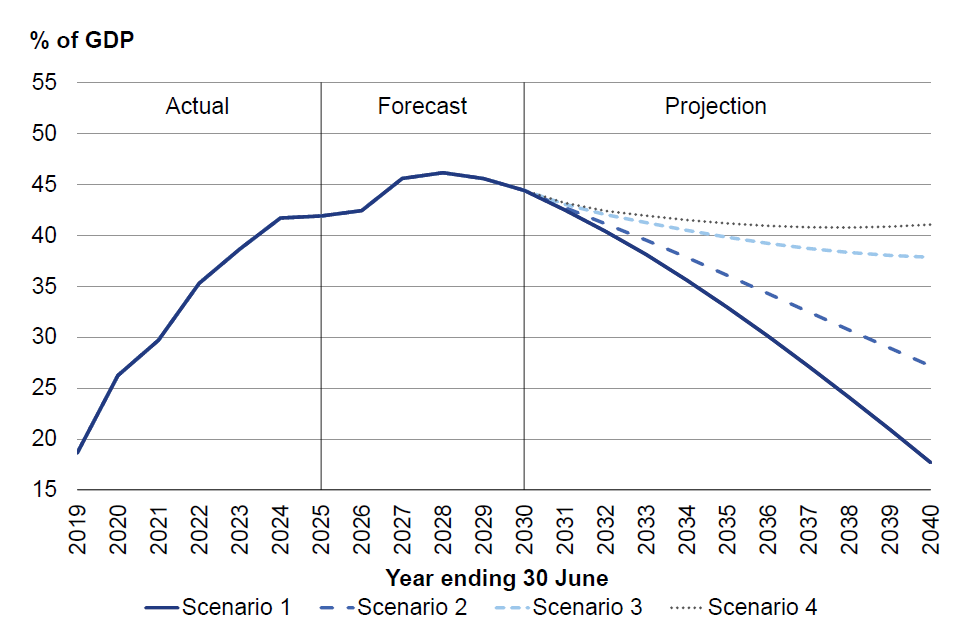
Source: The Treasury
Figure A2.2 — OBEGALx
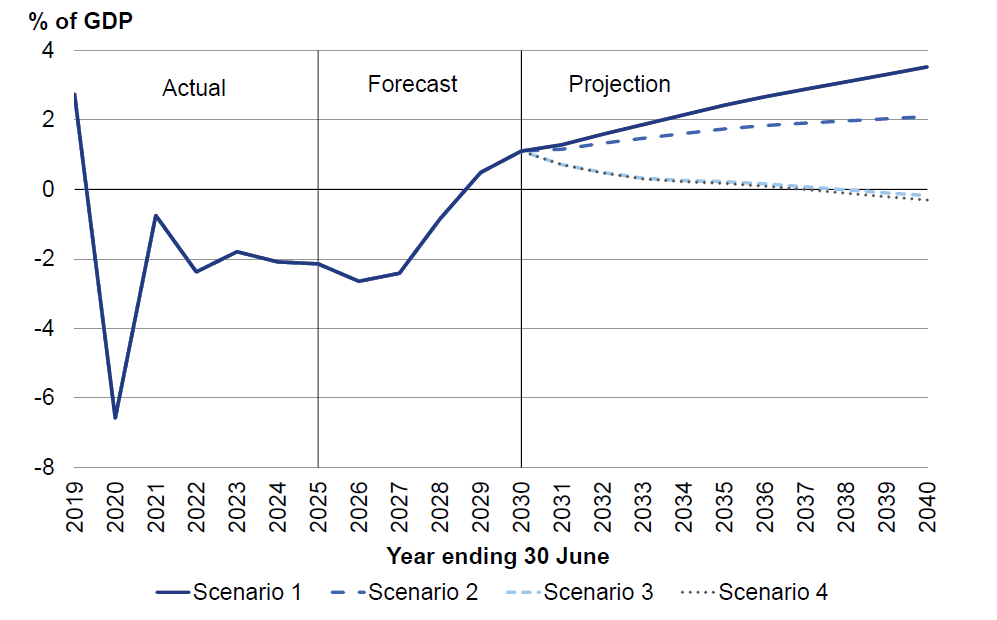
Source: The Treasury
Figure A2.3 — Core Crown expenses
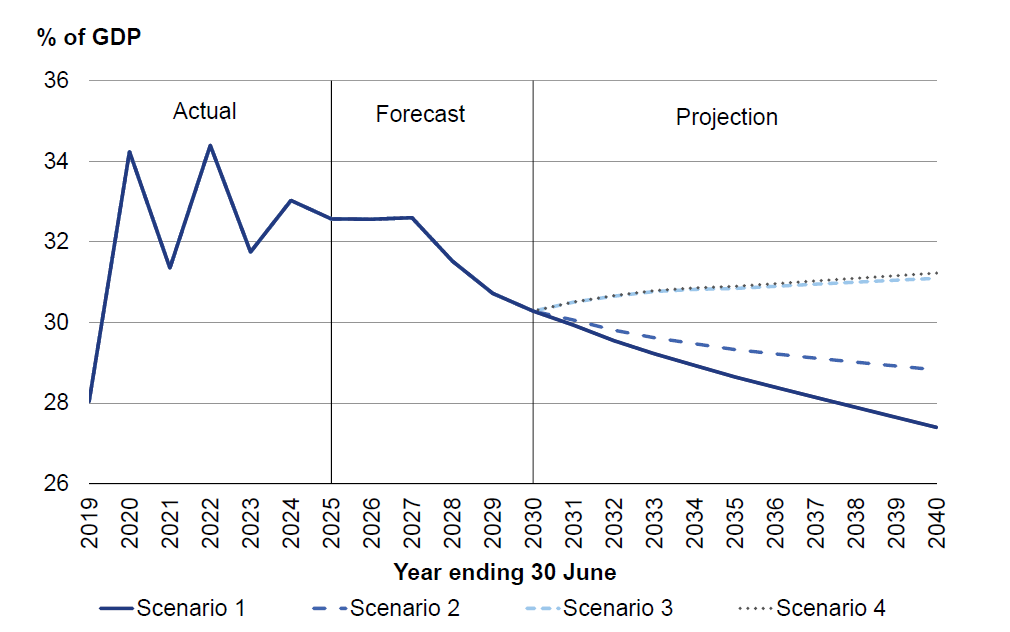
Source: The Treasury
The PFA requires an assessment of the consistency of these scenarios with the Government's long-term fiscal objectives.
Scenario 1 shows OBEGALx surpluses growing, core Crown expenses reducing to 27.4 per cent of GDP and net core Crown debt reducing to 17.7 per cent of GDP over the projection period (Table A2.1). This scenario is broadly consistent with the Government's long-term fiscal objectives, although debt decreases to below 20 per cent of GDP, which is under the long-term range for net core Crown debt.
Scenario 2 shows OBEGALx surpluses growing, core Crown expenses reducing to 28.8 per cent of GDP and net core Crown debt decreasing to 27.2 per cent of GDP over the projection period (Table A2.2). This scenario is consistent with the Government's long-term fiscal objectives.
Scenario 3 shows OBEGALx deficits in the later years of the projection period, core Crown expenses increasing and net core Crown debt reducing slowly as a percentage of GDP towards 37.8 per cent of GDP (Table A2.3). This scenario is inconsistent with the Government's long-term objectives for core Crown expenses and OBEGALx.
Scenarios 4 shows OBEGALx deficits in the later years of the projection period and core Crown expenses increasing as a percentage of GDP. Net core Crown debt reduces as a percentage of GDP before bending up again at the end of the projection period. As Table A2.4 shows, this scenario is inconsistent with the long-term objectives.
Table A2.1 — Fiscal indicators from Scenario 1
| Year ending 30 June | 2030 Forecast |
2032 Projection |
2034 Projection |
2036 Projection |
2038 Projection |
2040 Projection |
|---|---|---|---|---|---|---|
| % of GDP | ||||||
| Core Crown revenue | 31.4 | 31.1 | 31.0 | 31.0 | 30.9 | 30.9 |
| Total Crown revenue | 39.3 | 39.0 | 38.9 | 38.9 | 38.8 | 38.7 |
| Core Crown expenses | 30.3 | 29.6 | 28.9 | 28.4 | 27.9 | 27.4 |
| Total Crown expenses | 38.6 | 37.8 | 37.1 | 36.5 | 36.0 | 35.4 |
| OBEGALx | 1.1 | 1.6 | 2.1 | 2.7 | 3.1 | 3.5 |
| Operating balance | 2.0 | 2.5 | 3.2 | 3.9 | 4.4 | 4.9 |
| Net core Crown debt | 44.4 | 40.4 | 35.6 | 30.1 | 24.1 | 17.7 |
| Total borrowings | 65.7 | 62.5 | 58.4 | 53.2 | 47.4 | 41.1 |
| Net worth | 37.4 | 39.1 | 42.1 | 46.2 | 51.1 | 56.7 |
| Net worth attributable to the Crown | 35.6 | 37.4 | 40.6 | 44.8 | 49.8 | 55.5 |
Source: The Treasury
Table A2.2 — Fiscal indicators from Scenario 2
| Year ending 30 June | 2030 Forecast |
2032 Projection |
2034 Projection |
2036 Projection |
2038 Projection |
2040 Projection |
|---|---|---|---|---|---|---|
| % of GDP | ||||||
| Core Crown revenue | 31.4 | 31.1 | 31.0 | 31.0 | 30.9 | 30.9 |
| Total Crown revenue | 39.3 | 39.0 | 38.9 | 38.9 | 38.8 | 38.7 |
| Core Crown expenses | 30.3 | 29.8 | 29.5 | 29.2 | 29.0 | 28.8 |
| Total Crown expenses | 38.6 | 38.1 | 37.7 | 37.3 | 37.1 | 36.8 |
| OBEGALx | 1.1 | 1.3 | 1.6 | 1.8 | 2.0 | 2.1 |
| Operating balance | 2.0 | 2.2 | 2.6 | 3.0 | 3.2 | 3.4 |
| Net core Crown debt | 44.4 | 41.1 | 37.8 | 34.3 | 30.7 | 27.2 |
| Total borrowings | 65.7 | 63.3 | 60.6 | 57.4 | 54.0 | 50.5 |
| Net worth | 37.4 | 38.7 | 40.8 | 43.5 | 46.6 | 49.9 |
| Net worth attributable to the Crown | 35.6 | 37.0 | 39.3 | 42.2 | 45.3 | 48.7 |
Source: The Treasury
Table A2.3 — Fiscal indicators from Scenario 3
| Year ending 30 June | 2030 Forecast |
2032 Projection |
2034 Projection |
2036 Projection |
2038 Projection |
2040 Projection |
|---|---|---|---|---|---|---|
| % of GDP | ||||||
| Core Crown revenue | 31.4 | 31.1 | 31.0 | 31.0 | 30.9 | 30.9 |
| Total Crown revenue | 39.3 | 39.0 | 38.9 | 38.9 | 38.8 | 38.7 |
| Core Crown expenses | 30.3 | 30.7 | 30.8 | 30.9 | 31.0 | 31.1 |
| Total Crown expenses | 38.6 | 38.9 | 39.0 | 39.0 | 39.1 | 39.1 |
| OBEGALx | 1.1 | 0.5 | 0.3 | 0.2 | (0.0) | (0.2) |
| Operating balance | 2.0 | 1.4 | 1.3 | 1.4 | 1.3 | 1.2 |
| Net core Crown debt | 44.4 | 42.0 | 40.5 | 39.2 | 38.3 | 37.8 |
| Total borrowings | 65.7 | 64.2 | 63.3 | 62.3 | 61.6 | 61.2 |
| Net worth | 37.4 | 37.4 | 37.2 | 37.1 | 36.9 | 36.5 |
| Net worth attributable to the Crown | 35.6 | 35.8 | 35.7 | 35.7 | 35.6 | 35.3 |
Source: The Treasury
Table A2.4 — Fiscal indicators from Scenario 4
| Year ending 30 June | 2030 Forecast |
2032 Projection |
2034 Projection |
2036 Projection |
2038 Projection |
2040 Projection |
|---|---|---|---|---|---|---|
| % of GDP | ||||||
| Core Crown revenue | 31.4 | 31.1 | 31.0 | 31.0 | 30.9 | 30.9 |
| Total Crown revenue | 39.3 | 39.0 | 38.9 | 38.9 | 38.8 | 38.7 |
| Core Crown expenses | 30.3 | 30.7 | 30.9 | 31.0 | 31.1 | 31.2 |
| Total Crown expenses | 38.6 | 38.9 | 39.1 | 39.1 | 39.2 | 39.2 |
| OBEGALx | 1.1 | 0.5 | 0.2 | 0.1 | (0.1) | (0.3) |
| Operating balance | 2.0 | 1.4 | 1.3 | 1.3 | 1.2 | 1.0 |
| Net core Crown debt | 44.4 | 42.4 | 41.5 | 40.9 | 40.8 | 41.0 |
| Total borrowings | 65.7 | 64.6 | 64.3 | 64.1 | 64.0 | 64.4 |
| Net worth | 37.4 | 37.4 | 37.1 | 36.9 | 36.5 | 36.0 |
| Net worth attributable to the Crown | 35.6 | 35.8 | 35.6 | 35.5 | 35.2 | 34.8 |
Source: The Treasury