Economic outlook
Before the outbreak of conflict in the Middle East, an economic recovery was under way and was expected to broaden during 2026, underpinned by supportive monetary policy, exports, business investment and household spending. Inflationary pressures were expected to moderate.
Since then, the conflict has triggered a global supply shock that has sharply increased oil prices. Higher oil prices have raised the near-term inflation outlook, with direct impacts through increased petrol and diesel prices, and indirect impacts through higher transport costs affecting the prices of other goods and services (Figure 5). Over the medium term, inflationary pressures are expected to ease.
Figure 5 — Consumers price index inflation
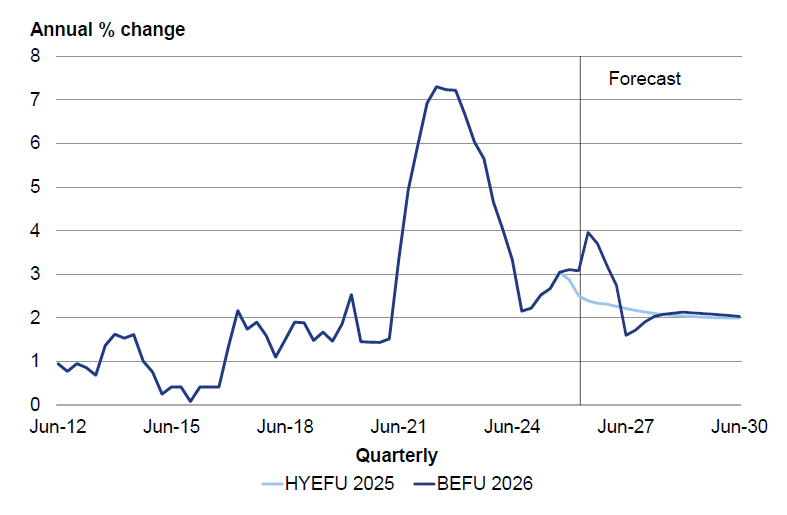
Sources: Stats NZ, the Treasury
Impacts of the global fuel crisis will delay but not derail the broadening recovery. BEFU forecasts show real GDP — the volume of goods and services produced in the economy — continuing to grow, although at a slower rate over 2026 and most of 2027 than was forecast in HYEFU (Figure 6). Unemployment is expected to peak at the same rate as in HYEFU — 5.5 per cent — but to do so in mid-2026 rather than in the first quarter.
Figure 6 — Real production GDP growth
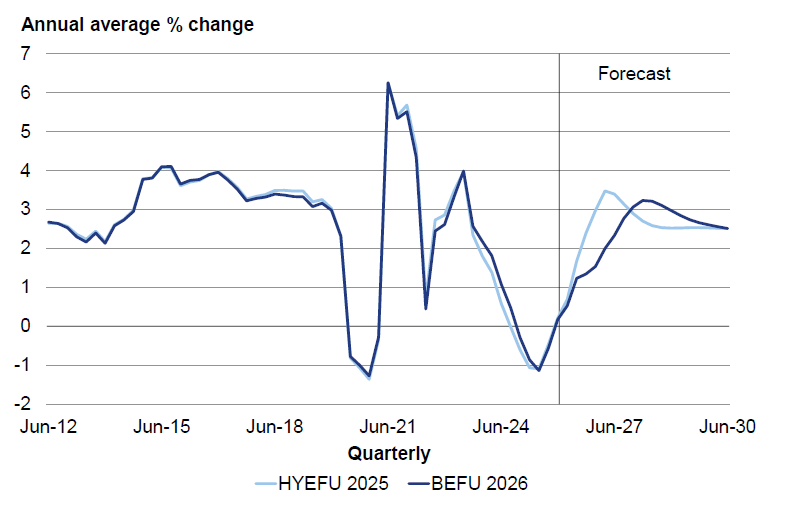
Sources: Stats NZ, the Treasury
Nominal GDP is the value of goods and services produced in the economy, in current market prices. It is affected by movements in both real GDP and prices. Nominal GDP is lower than previously forecast over 2026 and most of 2027, but picks up thereafter as real economic activity strengthens, the terms of trade (the ratio of export prices to import prices) improve relative to HYEFU and the price level is higher. From 2028 onwards, the level of nominal GDP is expected to be slightly higher than was forecast in HYEFU, due to an improved forecast for the terms of trade and an overall higher level of prices in the economy (Table 2).
Forecast tax revenue is slightly higher than expected in HYEFU (Table 2). This is because of higher nominal GDP, stronger recent outturns of some tax types that lift the starting point for the forecasts, the impact of higher expected interest rates on resident withholding tax, fiscal drag and other assumptions affecting the ratio of tax revenue to GDP.
Table 2 — Changes in nominal GDP and core Crown tax revenue forecasts
| Year ending 30 June $billions |
2026 Forecast |
2027 Forecast |
2028 Forecast |
2029 Forecast |
2030 Forecast |
|---|---|---|---|---|---|
| Nominal GDP | |||||
| BEFU 2026 | 452.2 | 474.9 | 503.7 | 529.8 | 554.4 |
| HYEFU 2025 | 454.5 | 479.0 | 502.2 | 526.2 | 551.1 |
| Change | (2.3) | (4.1) | 1.5 | 3.6 | 3.3 |
| Core Crown tax revenue | |||||
| BEFU 2026 | 124.8 | 133.0 | 142.2 | 151.6 | 159.7 |
| HYEFU 2025 | 124.2 | 132.2 | 140.2 | 148.4 | 156.6 |
| Change | 0.6 | 0.8 | 2.0 | 3.2 | 3.1 |
Source: The Treasury
Most of the change in forecast tax revenue was already anticipated prior to the conflict in the Middle East. The conflict has impacted tax revenue through a higher price level, but this has largely been offset by its negative impacts on real GDP.
These are the Treasury's central forecasts, but BEFU presents alternative scenarios, including an upside scenario where oil supply disruptions resolve more quickly than assumed in the central forecast, and downside scenarios where oil supply disruptions are more protracted.