Fiscal outlook
Economic forecasts impact the fiscal outlook in three main ways — through tax revenue forecasts, through forecasts of benefit and NZ Superannuation expenses (driven by expectations of inflation, wages and labour market conditions) and through the effect of interest rates on government finance costs.
The fiscal outlook is also affected by the size and phasing of the final Budget operating package. As discussed in the next section, the Budget operating package is smaller than previously forecast, with net new spending of $2.1 billion per annum, on average, compared to an allowance of $2.4 billion. It also has a frontloaded profile, with net new spending of only $1.3 billion in the last two years of the forecast period.
The BEFU fiscal forecasts are set out in detail in Annex 1.
Core Crown expenses are expected to remain stable as a share of GDP in the first two years of the forecast period, reflecting the frontloaded profile of the Budget operating package, the delayed recovery, and increasing benefit expenses due to higher short-term inflation and greater recipient numbers (Figure 7). Core Crown expenses then fall across the forecast period, reaching 30.3 per cent of GDP in 2029/30. Tight operating allowances in future Budgets are a key factor in this reduction.
Figure 7 — Core Crown expenses
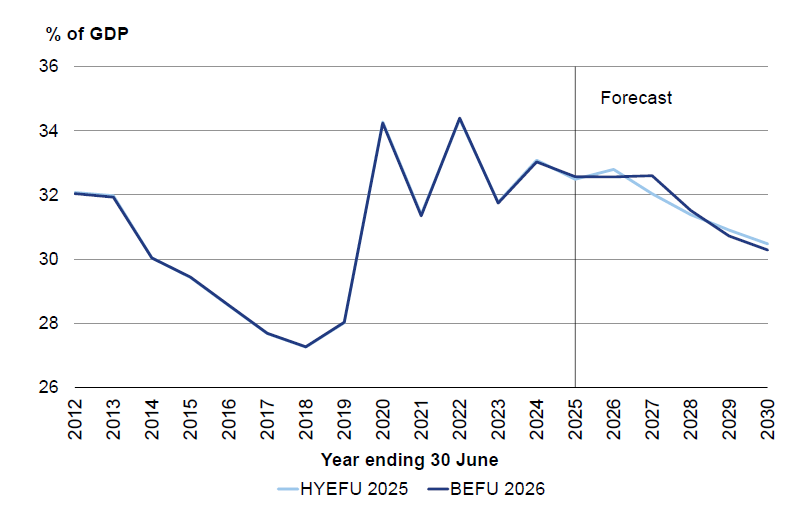
Source: The Treasury
OBEGALx is forecast to return to a surplus of $2.6 billion in 2028/29, as growth in tax revenue exceeds growth in core Crown expenses in the later years of the forecast period (Figure 8). The return to surplus happens a year earlier than was forecast at HYEFU. A slightly larger OBEGALx deficit is forecast in 2026/27, compared to HYEFU, but this is largely because of the phasing of the Budget operating package. Table 3 breaks down the changes in OBEGALx forecasts since HYEFU.
Figure 8 — OBEGALx
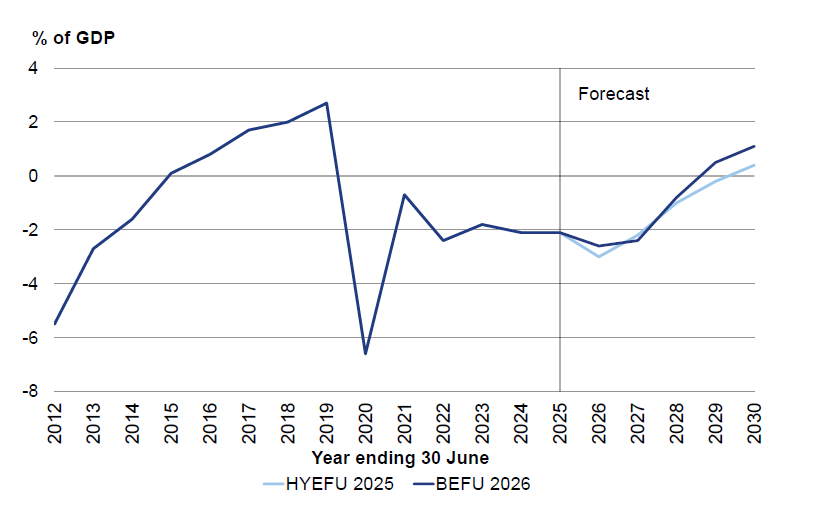
Source: The Treasury
Table 3 — Changes in OBEGALx forecasts between HYEFU 2025 and BEFU 2026
| Year ending 30 June $billions |
2026 |
2027 |
2028 |
2029 |
2030 |
|---|---|---|---|---|---|
| OBEGALx — 2025 HYEFU | (13.9) | (10.4) | (5.1) | (0.9) | 2.3 |
| Tax revenue (excluding Budget 2026 decisions) | 0.6 | 0.8 | 1.9 | 3.1 | 3.0 |
| Benefit and NZ Superannuation expenses (excluding Budget 2026 decisions) |
0.1 | (0.4) | (0.7) | (0.7) | (0.6) |
| Net finance costs | (0.1) | (0.1) | 0.2 | 0.2 | 0.1 |
| Budget 2026 package impact | 0.2 | (1.2) | 0.2 | 1.1 | 1.1 |
| Other movements | 1.2 | (0.1) | (0.8) | (0.2) | 0.2 |
| Total movement | 2.0 | (1.0) | 0.8 | 3.5 | 3.8 |
| OBEGALx — 2026 BEFU | (11.9) | (11.4) | (4.3) | 2.6 | 6.1 |
Source: The Treasury
A better OBEGALx outlook improves the path of net core Crown debt as a share of GDP, offset to some extent by an increase in capital investment in Budget 2026 and higher New Zealand Superannuation Fund (NZSF) contributions (see Annex 4). Net core Crown debt is forecast to peak at 46.1 per cent of GDP in 2027/28, 0.8 per cent of GDP lower than at HYEFU (Figure 9). Net core Crown debt is then forecast to bend down a year earlier than in HYEFU, declining to 44.4 per cent by the end of the forecast period.
Figure 9 — Net core Crown debt
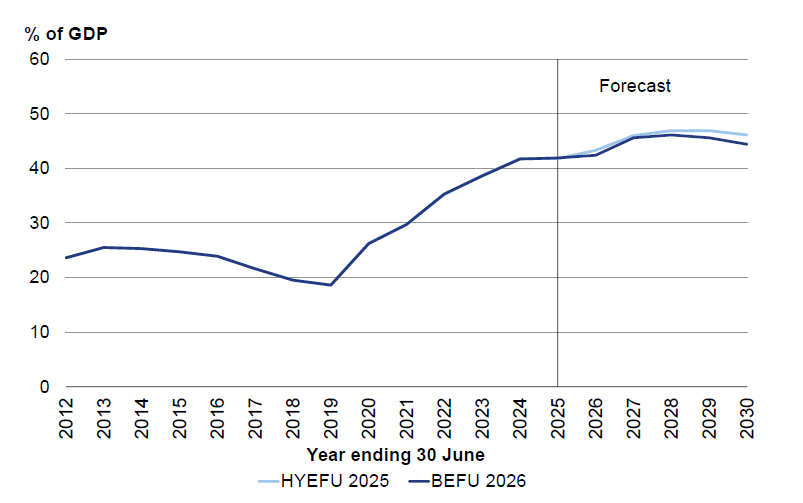
Source: The Treasury
Box 2 — How does New Zealand's fiscal position compare to similar countries?
Countries present fiscal data in different ways, so the International Monetary Fund (IMF) has developed its own measures to aid international comparisons, including:
- general government net debt, which includes local government and covers a broad range of financial liabilities and financial assets, and
- the overall balance (net lending and borrowing) which includes local government and includes capital as well as operating expenditure.
On these measures, Figures 10 and 11 compare New Zealand to the median of other small and medium-sized advanced economies. New Zealand has previously had low government debt compared to similar countries, which is appropriate given its vulnerability to natural disasters, reliance on commodity exports and dependence on international lenders. This gap has narrowed markedly, however, since 2018.
Following the COVID-19 pandemic, New Zealand's overall deficit has been considerably larger than in similar countries, although this is expected to narrow in the future as the government's books improve.
Figure 10 — General government net debt
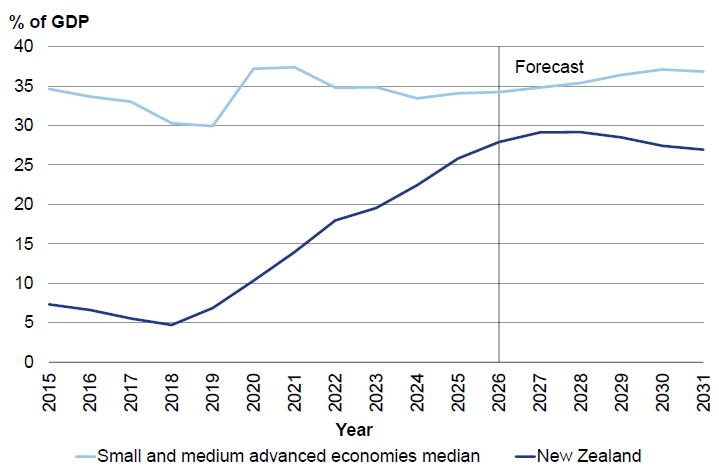
Source: IMF Fiscal Monitor April 2026
Figure 11 — Overall balance
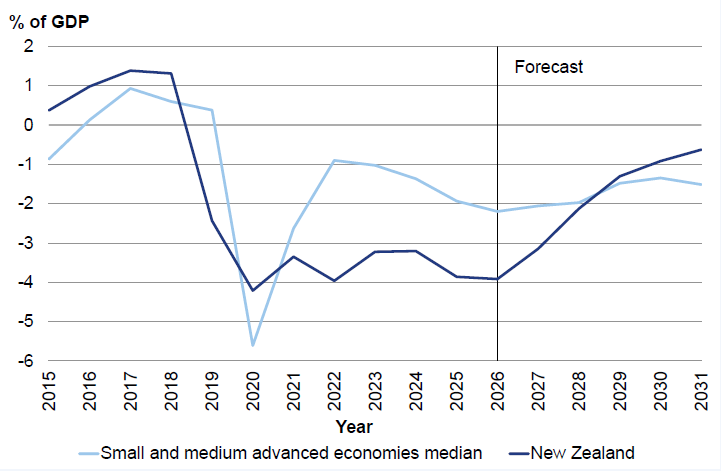
Source: IMF Fiscal Monitor April 2026
Note: In these charts, small and medium advanced economies are advanced economies excluding the United States, the United Kingdom, Japan, Canada, France, Germany and Italy, and excluding some economies with missing data. The IMF’s data does not incorporate the latest BEFU forecasts.
Projections of fiscal variables over a 10-year horizon, starting from the end of the forecast period, are in Annex 2. Annex 3 extends the analysis of changes in the economic and fiscal forecasts back to the Pre-election Economic and Fiscal Update (PREFU) in 2023.